Frozen ASE analysis table
Archived analysis record. Current Browse views report run-local descriptive allelic-balance observations.
Download TSVscTHREAD integrates 453 run records from 34 human and mouse datasets and 923,389 cells, with more than 200,000 observed transcript isoforms. Uniform processing supports comparable views of isoform usage, poly(A) site choice, allelic balance and recurrent novel junctions, with coverage reported separately for each evidence layer.
Human and mouse long-read transcriptomes
Each result reports the runs and biological units that contribute to that evidence layer.
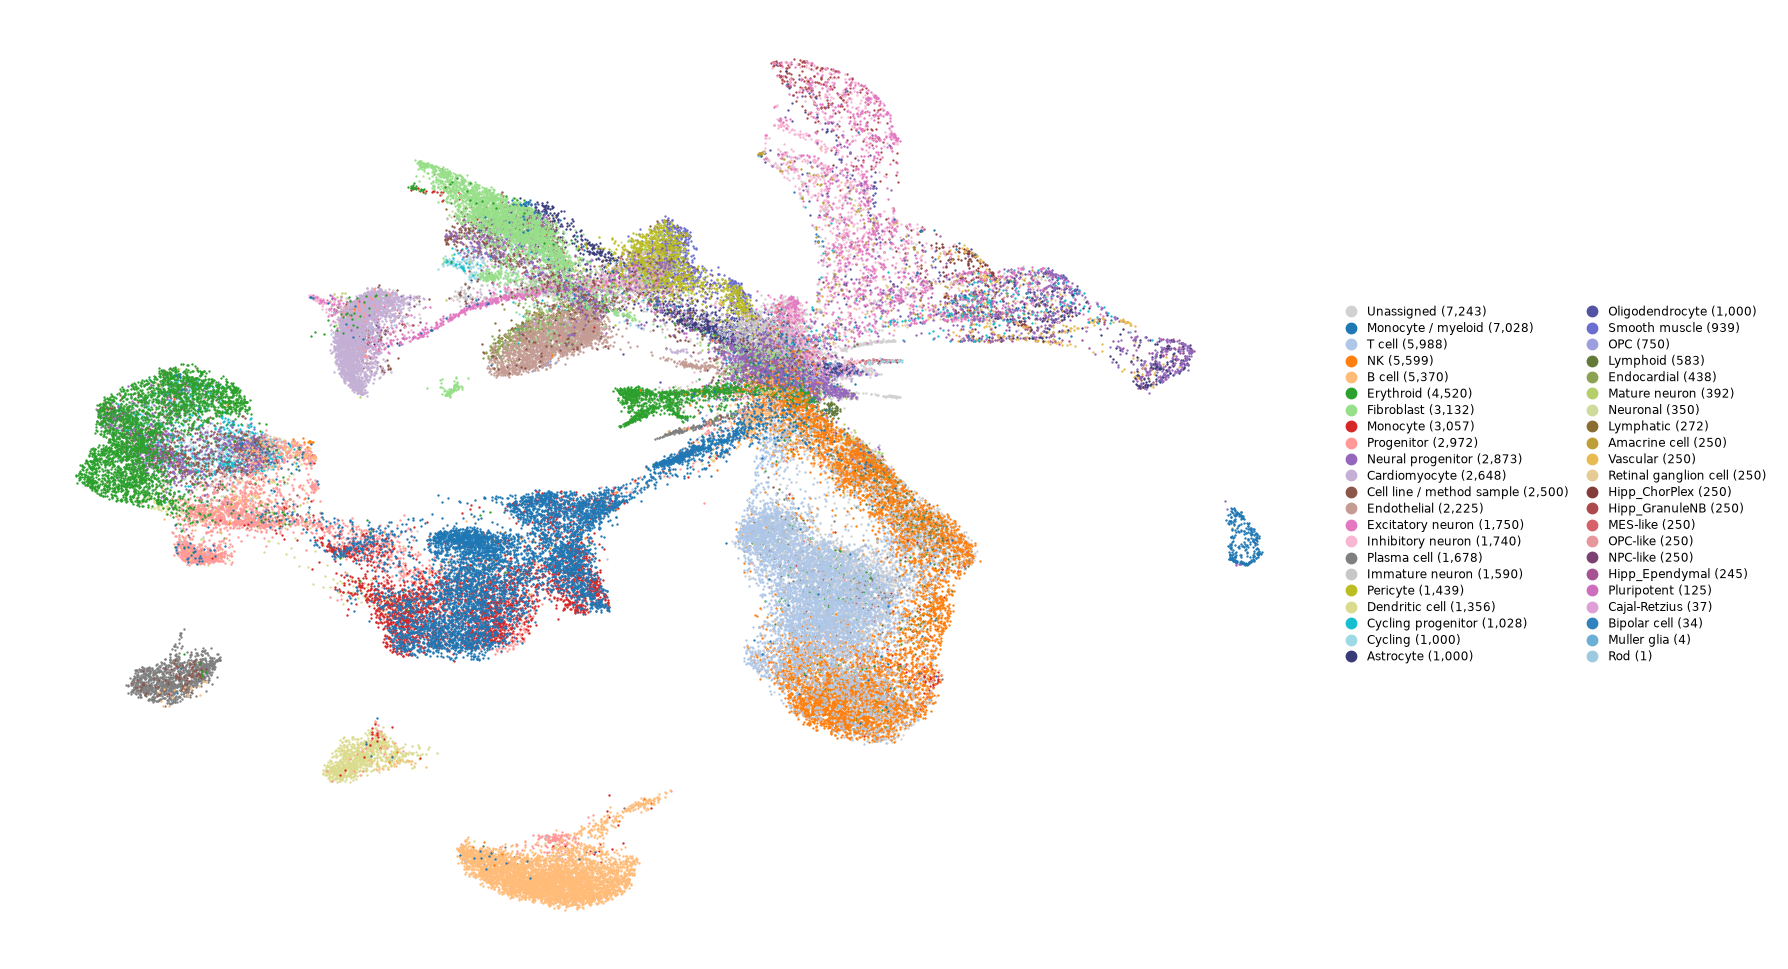
Cell-resolved portal atlas: 141,313 cells across 21 datasets (123 runs, 90 cell types). UMAP is exploratory and does not imply trajectory.
| Junction | Span | Molecules | Reads | Runs | Studies |
|---|
Live data scope: results report their contributing runs and biological units by evidence layer. Region queries are aggregated on demand and bounded to a 5 Mb window.
Choose a species first. Then open a dataset directly or search by biological context, gene, accession or coordinate.
Labels describe tissue, disease or cell line; accessions remain available in the results.
Loading the catalog scope…
Inspect NIC/NNC model IDs observed in the release's discovered-transcript layer. Repeated IDs across runs remain separate observations; no cross-run equivalence is assumed.
Enter a model, run or dataset to inspect the run-local index.
Compare the same feature between two cell types across selected studies. Study comparability is checked when you select cell types, before running the comparison. Per-study direction agreement is descriptive; limited or unavailable evidence remains visible.
The result will show which transcript feature differs and how many paired samples support the comparison.
One row per selected isoform and one column per evaluable selected study. The difference view keeps the A/B pairing gate of the comparison above; the descriptive view browses one cell type without any pairing gate. Cells show their actual supporting sources; low support is marked limited, and unavailable is never plotted as zero. Studies that cannot evaluate this query fold into an explicit list below the matrix. The isoform selection is shared with the UMAP workspace.
One row per selected study: its cell-type reference map, then one panel per selected isoform. Panels within a row share cells, coordinates, zoom and hover; rows are independent studies and are never geometrically aligned or linked. All expression panels in the workspace share one color scale.
The workspace follows the gene, species and study selection above.
See whether it was observed, where it recurs and whether it uses canonical splice sites.
Results will show observation, recurrence, splice motif and supporting molecules.
For one junction, estimate pooled usage when measured coverage is incomplete. A higher score means the model ranks it closer to frequently used junctions; it is not a probability and does not compare cell types.
Out-of-domain junctions return no score.
Human and mouse sequencing runs enter without relying on published aggregates.
Protocol-specific barcode and UMI recovery followed by IsoQuant transcript assignment.
Run-aware barcode joins and per-cell UMI deduplication.
Isoform, PAS, junction and allelic views from one read-facts layer.
Long-read alignments and IsoQuant assignments are processed uniformly within each run. Gene, transcript, poly(A)-site, junction and allelic evidence use run-aware barcode namespaces; UMI deduplication is applied where molecule tags are available. Every decision below is recorded per run in the frozen processing manifest.
Decision rules. A run is barcode-resolved when every read carries a cell barcode (read group tag:CB); otherwise it is one library per file and cell identity comes from the file name. Assignment uses GENCODE v44 on GRCh38 (human) and GENCODE vM33 on GRCm39 (mouse). The 77 runs without a retained IsoQuant log keep an explicit unverified version label; the pipeline-level version is not extrapolated to them. Core layers (gene counts, transcript counts, read assignments, transcript models) are present for all 453 runs; DIU, APA, junction and ASE layers are present where the underlying measurements exist.
IsoQuant 3.13.1 (per-run verification above). Cell-map builds used scanpy 1.10.3, harmonypy 0.2.0, umap-learn 0.5.12 and scikit-learn 1.6.1; integration diagnostics run kNN (k = 15) on the displayed coordinates and flag a batch-concentration ratio above 3. Per-run records: processing manifest API · frozen manifest TSV · embedding provenance TSV.
On-demand comparisons merge technical runs into registered biological sample or capture units. One independent unit is a study_id + donor_or_source_id pair; technical runs and repeated states are summed before testing. The interface offers only cell-type pairs supported by at least three shared independent units, and a gene is tested only when it has at least 3 donors per cell type and a minimum depth of 20.
Permutation test. For each gene, cell-type labels are permuted 9,999 times at the biological-unit level (seed 20260727). Matched null calibrations (3 seeds × 200 permutations each) yield zero FDR discoveries in every layer. The reported effect is the equal-donor estimand (effect_equal_donor): each donor contributes equally, not each pooled read count.
Multiple-testing correction. Benjamini–Hochberg q-values at a 5% FDR; a gene is significant only with q < 0.05 and an absolute equal-donor effect of at least 0.2. The q-values and significance flags were recomputed independently, without statsmodels; the largest discrepancy across the observed layers is 2.22 × 10⁻¹⁶.
| Layer | Genes tested | Significant (FDR 5% + effect ≥ 0.2) | Raw p < 0.05 fraction | Null raw p < 0.05 range (3 seeds) |
|---|---|---|---|---|
| Isoform usage (DIU) | 8,092 | 2,008 | 0.458 | 0.026–0.060 |
| Poly(A) site usage (APA) | 10,531 | 2,558 | 0.551 | 0.027–0.049 |
| Allelic balance (ASE) | 6,930 | 0 | 0.078 | 0.040–0.047 |
Allelic balance remains descriptive in live views because haplotype labels are not phased consistently across units; the frozen ASE run above is an archived analysis record in which no gene passes the significance rule.
The optional junction-usage model is sequence- and RBP-informed (220 RBP profiles). Held-out validation: pooled Spearman 0.440, cell-type mean 0.112, cis-only 0.082, shuffled-RBP control 0.139. The estimand is a relative pooled donor-anchored usage propensity — not a calibrated PSI, a probability of biological validity, or a cell-type-specific effect; junctions outside the model domain return no score.
The frozen release 2026-08-03 is the current portal denominator: 453 run records from 34 human and mouse datasets and 923,389 cells. The live catalog remains the rolling view for Search and Browse.
| Study | Biological context | Run accession | Species | Platform | Library kit | Cells | Assay | Status |
|---|---|---|---|---|---|---|---|---|
| Loading run-level metadata… | ||||||||
Archived analysis record. Current Browse views report run-local descriptive allelic-balance observations.
Download TSVVerified gene-level RNA-processing results.
DIU CSVAPA CSVThe current website archive contains code only: website source, source-index builders and tests.
Current website source (code-only archive)
Frozen 453-run layer contract with public availability, byte counts and status fields; internal paths are redacted.
Download TSVisoquant_core_status and file_contract_status.run_assay_resolution.tsv, 42 PacBio runs are recorded as consensus reads supported by model and source records, but no per-file inspection has confirmed the read type; the 12 runs confirmed by FASTQ inspection say so explicitly in the same column.isoquant.log was retained for the run, so the version cannot be re-verified per run and the pipeline-level version is not extrapolated to it (77 runs).Identity-resolution terms (barcode-resolved, sample/file-resolved) and count scopes are defined in the About glossary.
tag:CB); sample-file-resolved runs (298) are one library per file, so cell identity comes from the file itself. Together they partition all 453 runs; deposited assay labels remain record-level metadata.Five cell counts appear across the portal. Each measures a different scope, so the numbers are expected to differ; none is an error.
Loading count scopes…
Open PTPRC search results and select the human gene record.
On the gene page, compare the analysis-status strip with the shared-coordinate cell map.
Choose an isoform, inspect its usage denominator, then open the junction tab and apply the molecule filter.
Export the visible table or reproduce the overview through the documented API.
Scope rule. Counts in a filtered browser table are not database-wide totals. Each overview and export labels its evidence layer and scope; the frozen manuscript manifest is separate from the rolling live registry.